The extended EFAS domain was put in operations on the 16 May 2018, and it is now time to make an assessment over the performance over this first year. The assessment of skill scores where done over the period 1 June 2018-31 July 2019, well over a year. The skill was computed using the continuous ranked probability skill score (CRPSS). The proxy for observations were the simulations forced with observations. For this validation, the catchments in Africa were omitted.
Current skill of the forecasts
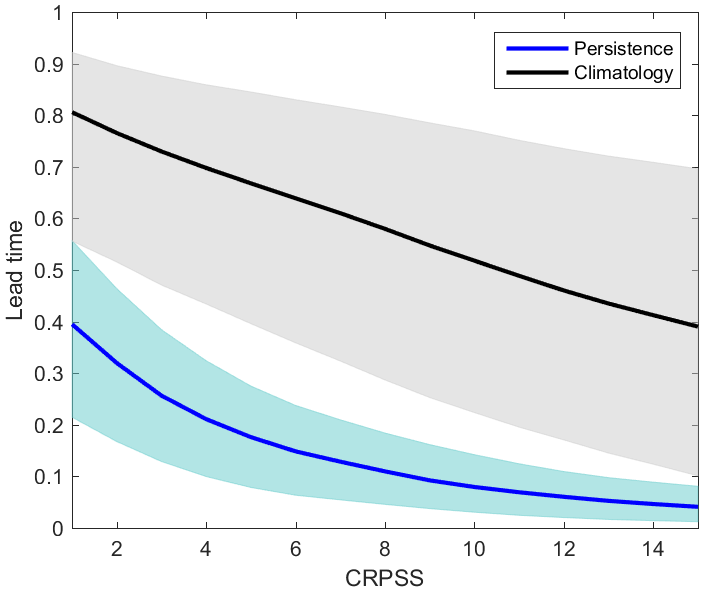
The CRPSS for the first 15 days of forecasts shows a good skill against climatology (Figure 2), whereas using the previous day’s forecast as your reference forecast shows a more rapidly decreasing skill. Any skill above 0 is considered better than the reference forecast. The performance shows a strong spatial variability, where the model performs generally better in the northern part of Europe than in the south. It can be noted that the larger rivers perform on average better than smaller rivers (top figure).
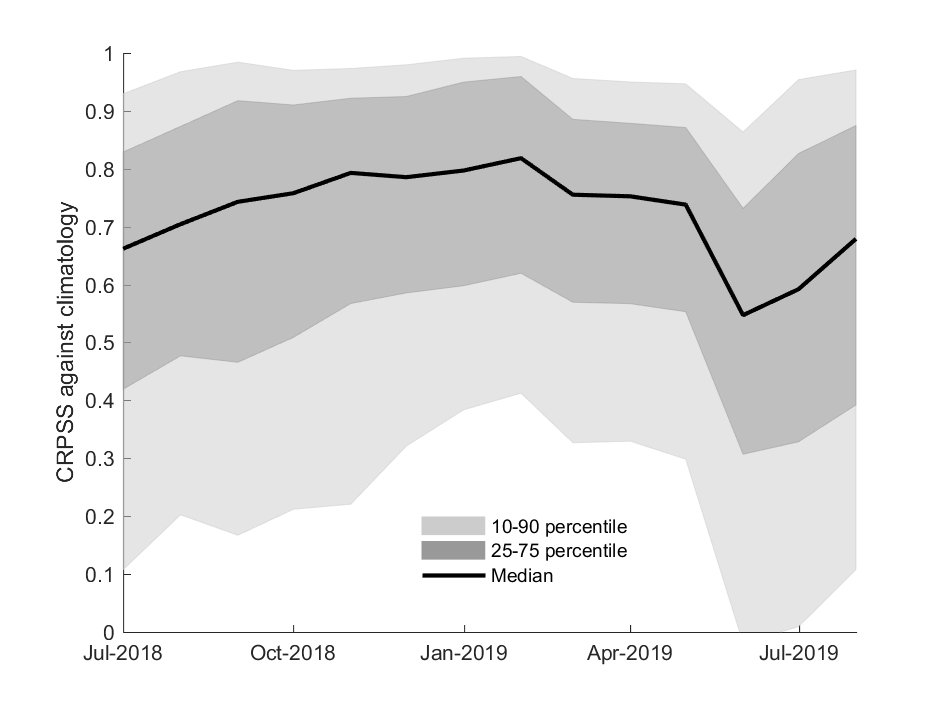
The skill also varies greatly over the year, which can be seen in Figure 3. The skill in winter is normally higher than in summer, because most rivers are at their lowest flow during that season. The variability is small, which makes it easier to predict. It is yet not enough data to say something more substantial about the long-term score development of EFAS.
Plans for verification
The plans for EFAS verification will follow several development paths. Firstly, the points where we have observational data in near-real time will be used for an assessment of the skill of the forecasts against observations. This will give a better understanding of the real value of the system in those points. Secondly, hindcast experiments will be able to give an idea of the development of the scores over time. Such experiments will take time to run and will be presented at a later stage. Thirdly, verification of the issued notifications is a priority. Currently, there is not enough feedback to properly assess this, but the new web interface will enable a more systematic assessment of this skill.