by EFAS Hydrological Data Collection Centre
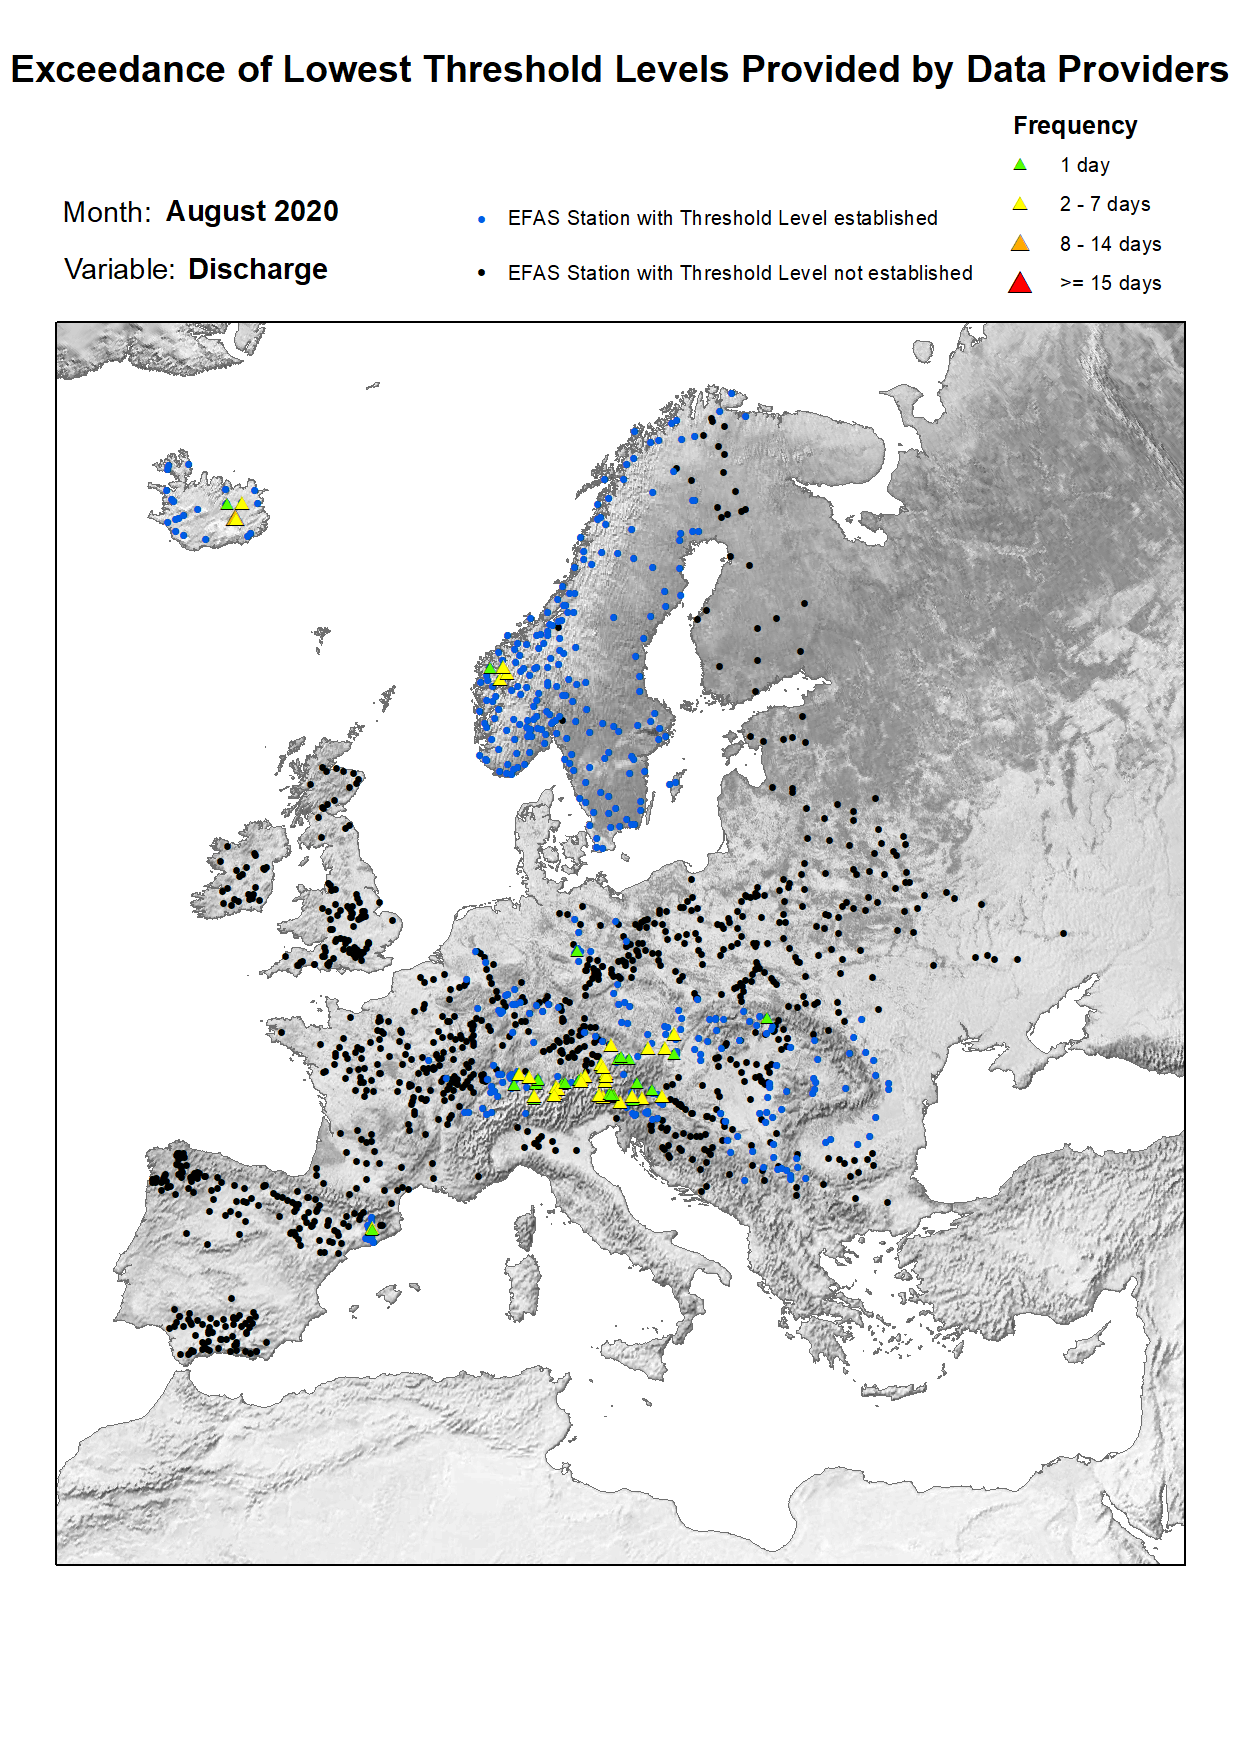
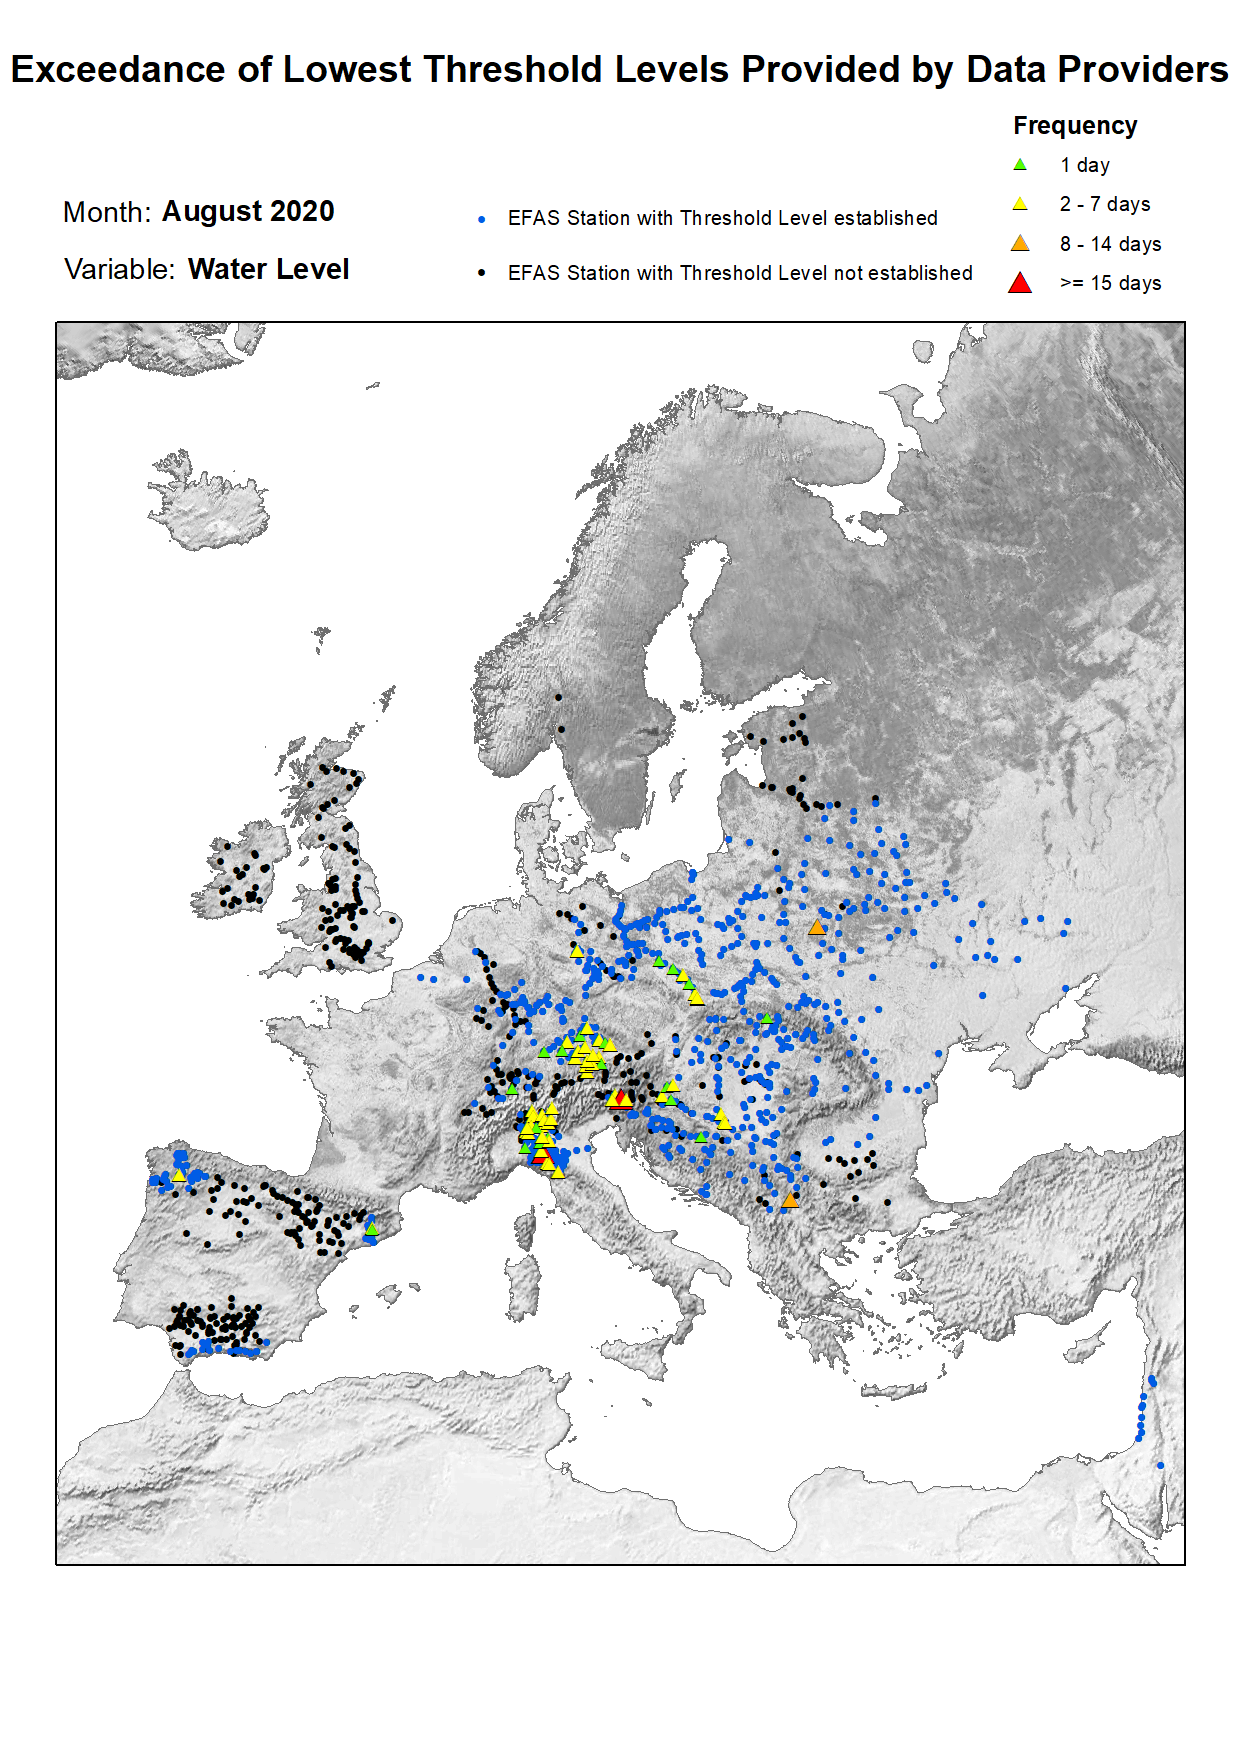
In August, the main concentration of stations that exceeded their lowest threshold level is located in central Europe: Poland and Germany (the Oder and Elbe basins respectively); the Danube basin across Austria, Hungary, Slovakia and Croatia; the Po basin in Italy; and the southern Rhine basin in Switzerland. Exceedance took place for more than twenty days in the stations located on Parma, Riglio, and Stirone Rivers (the Po basin); on the Tisza River; and on Lake Ossiach (the Danube basin). As can be seen in Norway, four stations located on the west side; the Storelvi, Breelvi, and Loelva rivers, exceeded their threshold for two days. Three stations in the Bakkahlaup basin and one in the Skjalfandafljot basin (Iceland), and three stations in Spain (the Llobregat and Minho basins) exceeded their lowest threshold level.
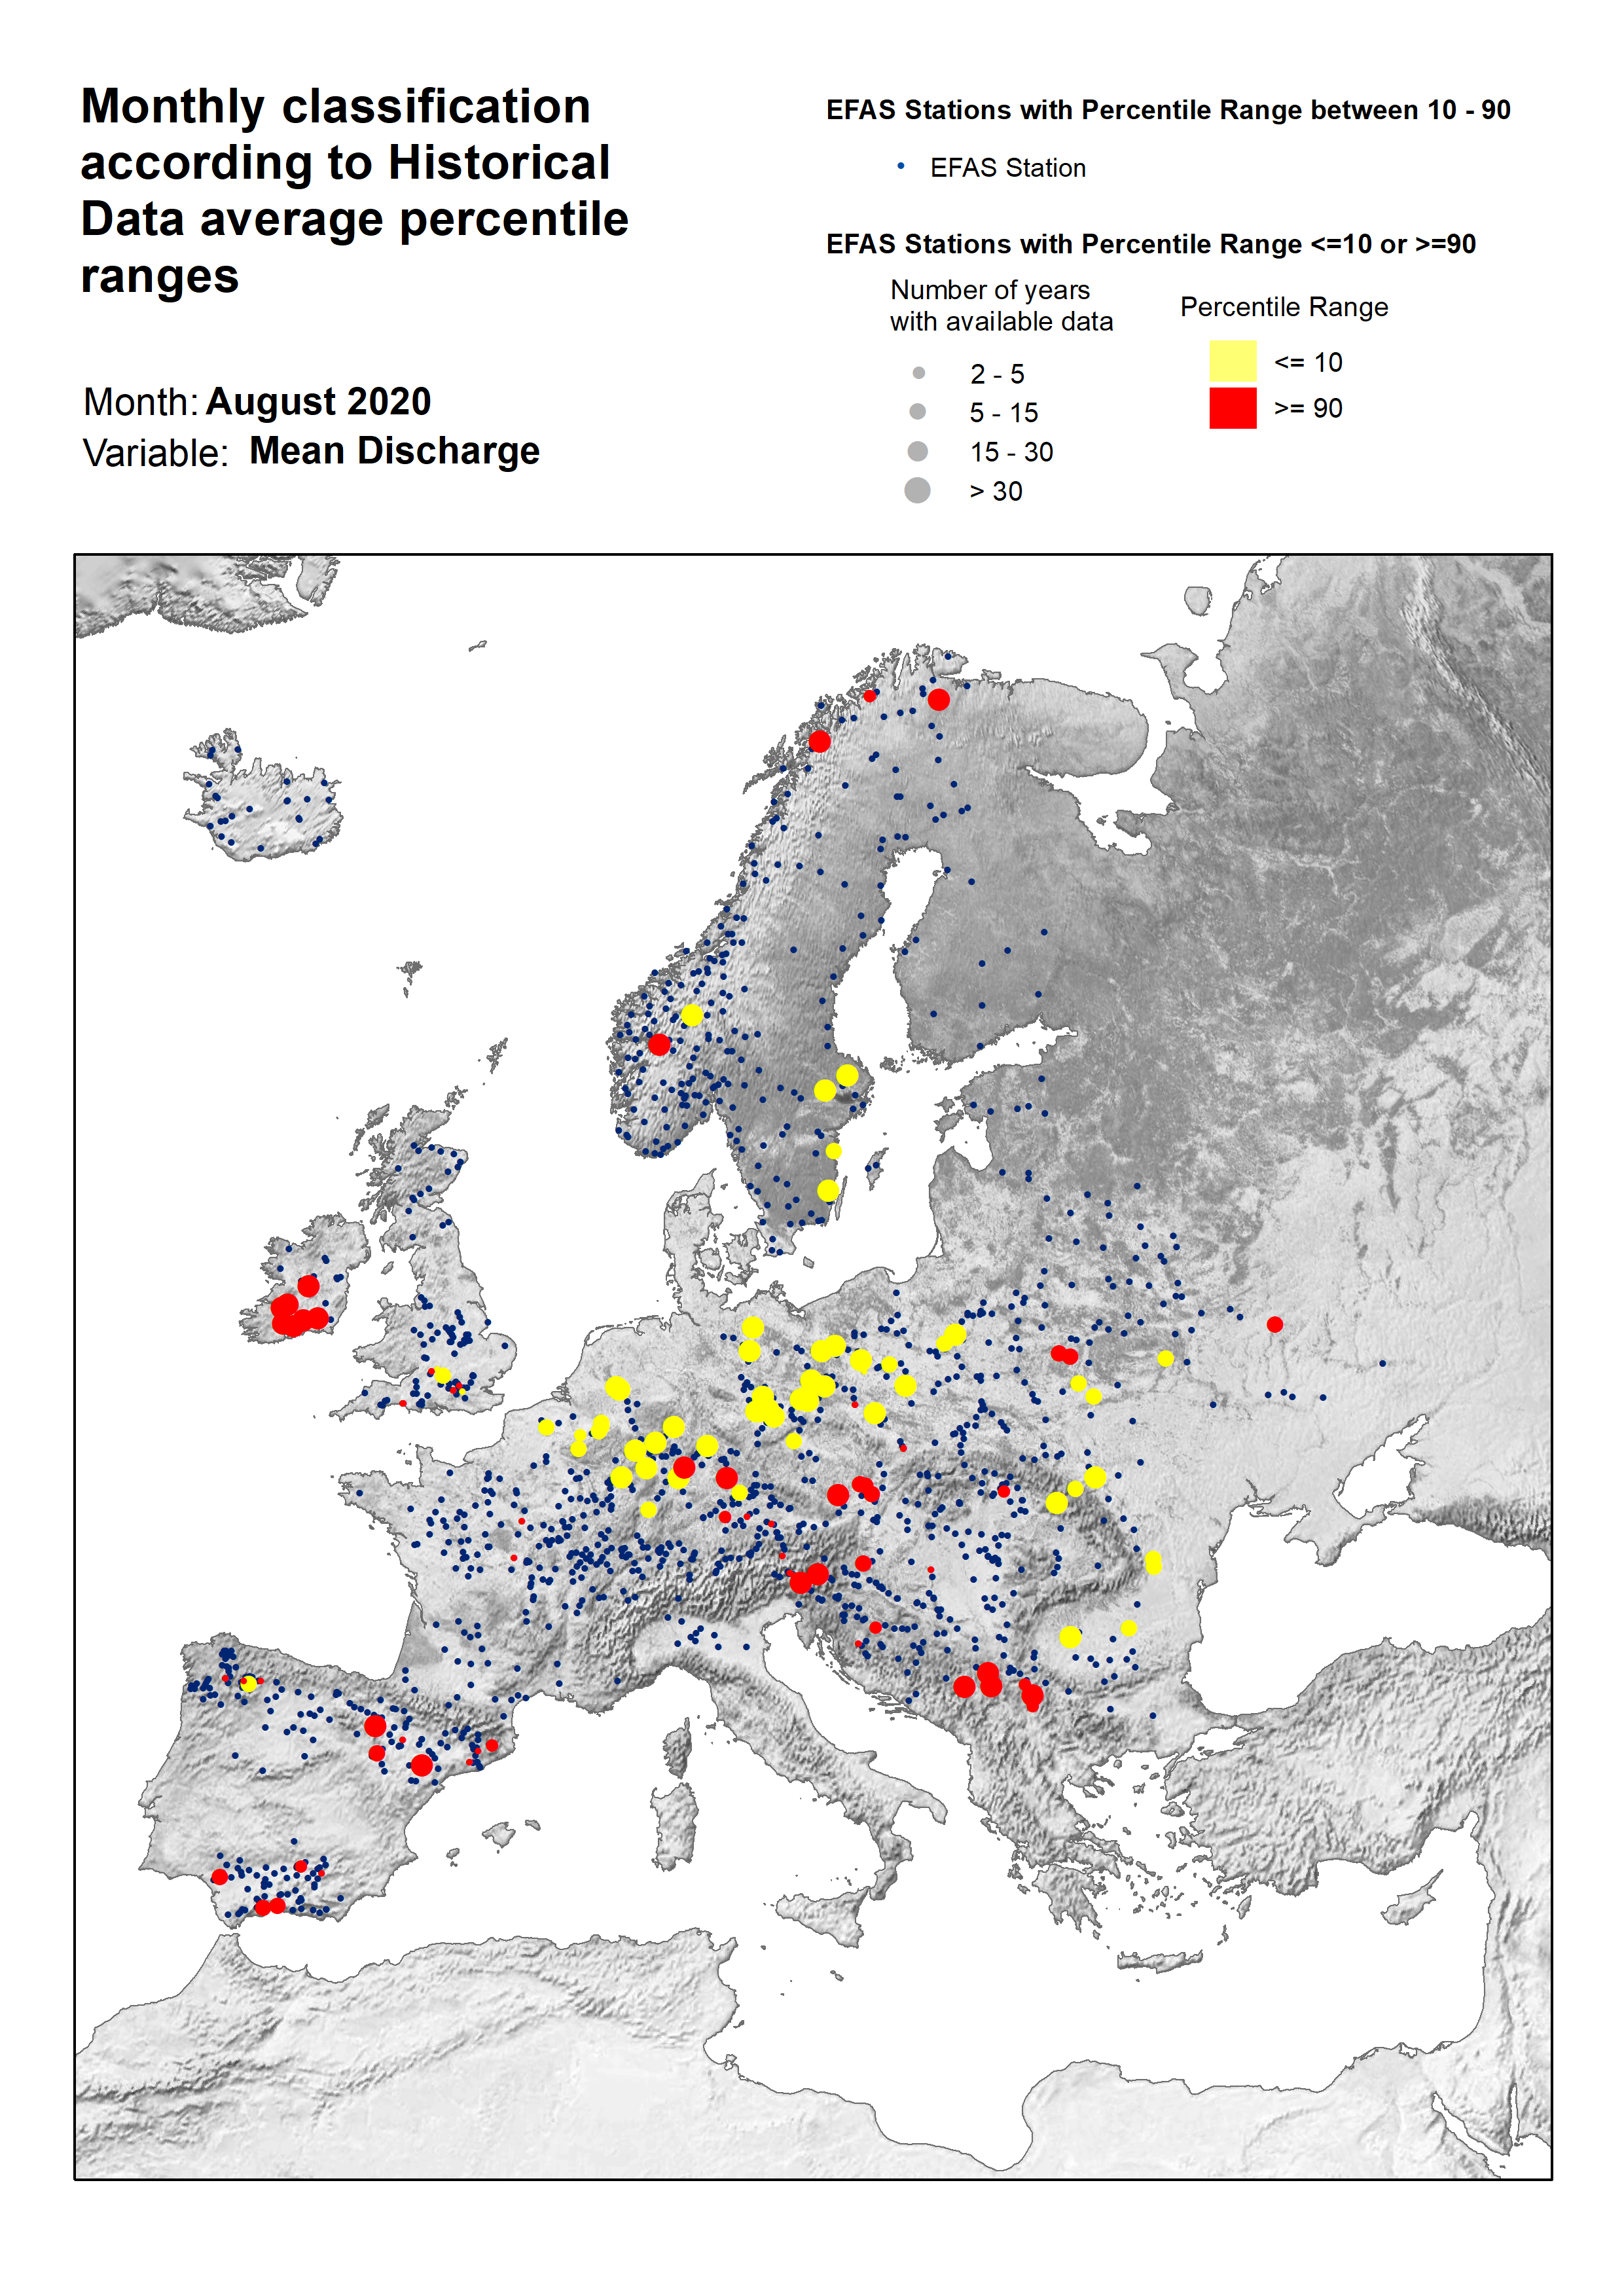
The stations that exceeded the quantile 90% are scattered throughout the European continent. Spain stands out with 15 stations having values higher than this quantile in the Guadalquivir, Guadalhorce, Velez, Minho, Ter, and Llobregat basins. The stations located in the Danube basin are remarkable too. These stations represent 36% of the stations that exceeded quantile 90%. The rest of stations are in France (the Loire and Seine basins), Germany (the Rhine basin), Poland (the Oder basin), Ukraine (the Dnieper basin), southern and central Ireland, southern United Kingdom, and Norway.
Finally, 63% of the stations that met the quantile value of under 10% for August are located in Poland, Germany, and Belgium. The rest of the stations are scattered throughout the United Kingdom, the Netherlands, Spain, Romania, Ukraine, Czechia, Norway, and Sweden.


