by Louise Arnal and Shaun Harrigan, ECC
Over the late spring and early summer, the central and northern parts of Europe experienced persistent dry conditions with record-breaking temperatures. This led to extensive and wildfires in the UK, Sweden, Greece, Spain, Portugal, Latvia and Germany as well as very dry conditions. The cause of this was a very northerly path of the jet-stream with led to very stable anticyclonic conditions over norther Europe. Here, we look back at how the hydro-meteorological anomalies developed over the summer to see how well the EFAS seasonal outlook captured the low river flow conditions in Europe.
EFAS seasonal outlook for the summer 2018
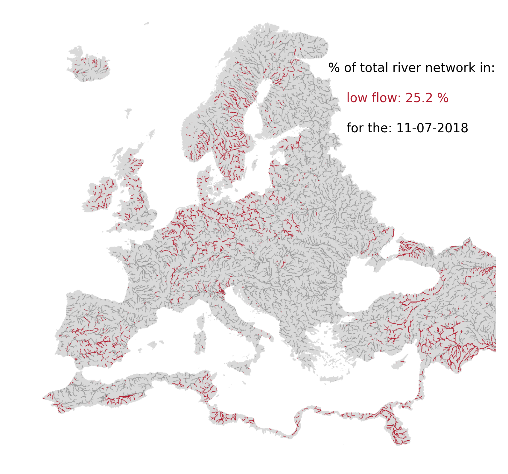
It is clear from the EFAS hydrological simulation that rivers were experiencing dry conditions across Europe since the start of the summer (Figure 1). On June 11, 12.4% of the river network was in a low flow anomaly (i.e. below the 10th percentile of climatology). On July 11, the low-flow anomaly extended to 25.2% of the river network and by August 11 covered over one third (35.1%) of Europe. Although the spatial patterns of the low flow signal were not perfectly captured by the EFAS seasonal outlook it did forecast an intensifying low flow signal throughout the summer, with a lead time of several weeks in some cases.
June 2018
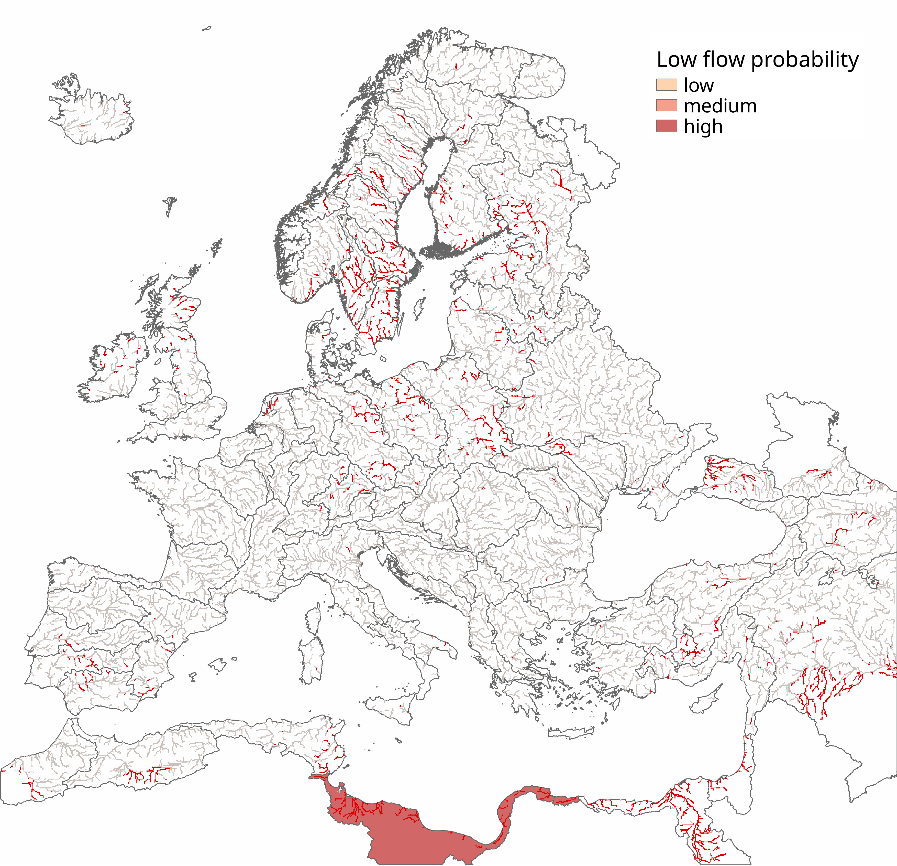
Most of the low flows mid-June where primarily located around southern Sweden and northern Africa. These were however not picked up very well by the EFAS seasonal outlook produced in May (Figure 2).
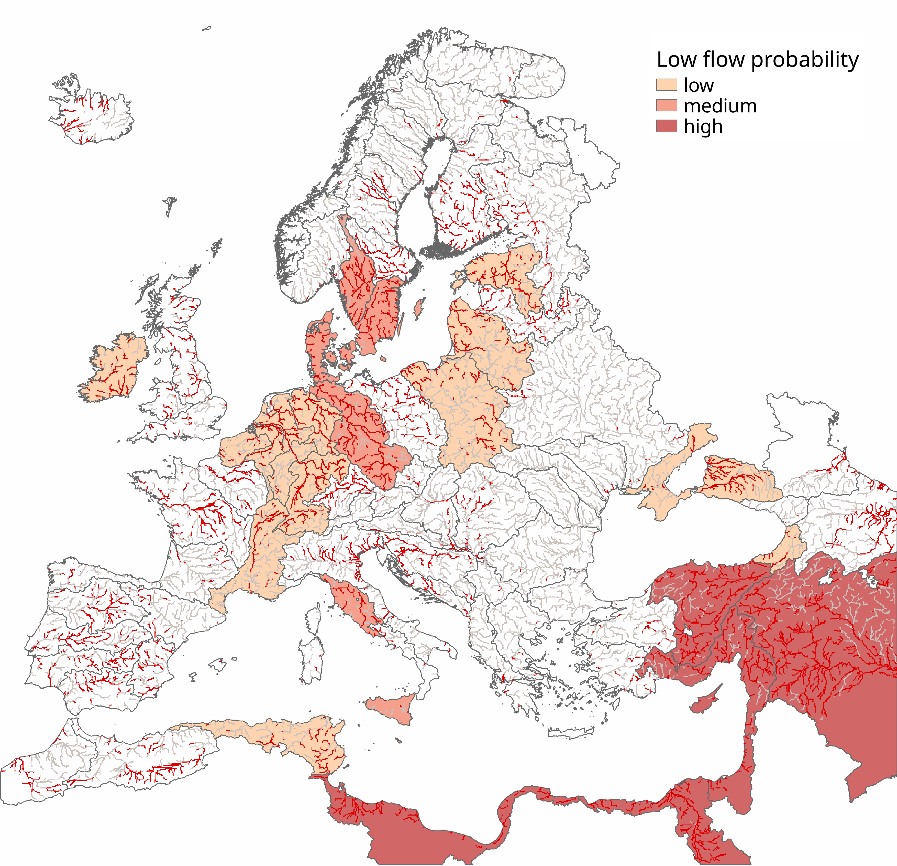
July 2018
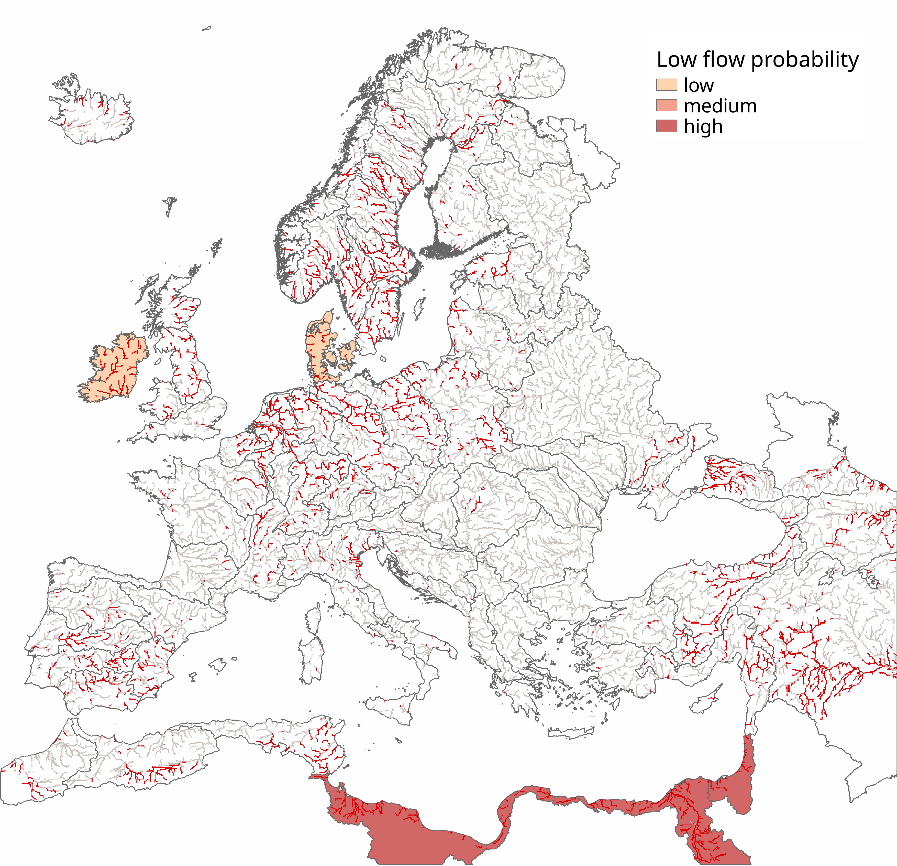
By mid-July, the low flows had extended to most of the British-Irish Isles, larger parts of Sweden and southern Norway, central Europe (around the Rhine, Po and Elbe river basins), the southern Iberian Peninsula and eastern Europe. The EFAS seasonal outlook from June valid for mid-July provided an early warning of low-flows in North Africa, Ireland and Denmark, but the signal was not well predicted for most regions six weeks ahead.
August 2018
By mid-August, the lows flows had extended to cover most of Finland and western Europe (including most of the Iberian Peninsula and France; Figure 4). This was well predicted by the EFAS seasonal outlook made from July valid for mid-August with a lead time of six weeks. The forecast signal was however quite weak because of the forecast’s inherently growing uncertainty with lead time and missed most of western Europe. The performance of the EFAS seasonal outlook can here again be partly attributed to the SEAS5 forecast anomalies for August, which were weaker and shifted eastwards in the July forecast compared to the August forecast.
Overall, the EFAS seasonal outlook did manage to predict the summer 2018 low flow conditions more than a month ahead in parts of Europe (noticeably the July forecast). The weak anomaly signals in the SEAS5 forecasts made on 1June (July) for July (August) likely contributed to the lack of hydrological predictability in many regions more than a month ahead. Much of the predictability of EFAS-Seasonal in summer can be contributed to initial hydrological conditions. Looking back at this event and similar ones should help us understand the EFAS seasonal outlook’s predictability and uncertainty sources and help improve the forecasts to better capture future events.