by ECC and EDCC
The EFAS Computational Centre plans the release of the new EFAS-IS web interface in the beginning of 2019. This is the end of a long project with close collaboration between the developers and the users. The new web interface is modern, user-friendly and flexible and is an important step towards a more harmonized view of all Copernicus Emergency Management Service (CEMS) components. The new portal is compliant to the Copernicus services guidelines.
In the new web interface sections have been reorganized for easier navigation. Access to data is advanced with more interactive and queryable maps. Data is also accessible to external users with limited functionality. The interface has a faster response than the former one. The general look and feel of the web site have been revamped. The viewer of the new web interface is optimized for use on mobile devices such as tablets and smartphones.

Users can access the new interface as anonymous viewer or as an authorized user. Only authorized users can access all functionality. The functionalities available depend on your user profile: forecaster, registered user (i.e. EFAS partner with signed CoA) or common user.
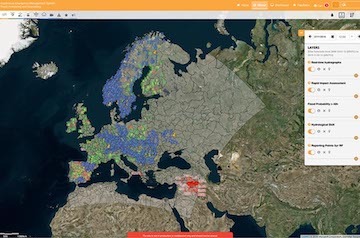
In the new map viewer layers can be selected through icons in the tool bar on the top of the screen. Layers can be added intuitively to the map. When a layer is added to the map, a floating panel appears in the map, in which you can manage the selected layers. From the panel, it is possible to show, hide or rearrange the layers. Active flood notifications can be shown by clicking on the flood notifications icon. Custom Web Map services can be easily added to the interface.
One of the most interesting new features of the new web interface is the dashboard. The dashboard is your personal workspace where you can store and load predefined displays to show the EFAS information the way you prefer. Multiple maps and graphs can be sized and positioned within the dashboard space. You can freely move between map viewer and dashboard by clicking on the relevant buttons.
A new selection icon in the tool bar of the map viewer is the Feedback icon. By clicking this button users are redirected to a page on which they can provide feedback on received Formal Flood Notifications as well as report missed flood events. Partners will still get an email with a request to fill out the feedback form for received Formal Flood Notifications.
In addition to the new look of the Map Viewer (former called “Forecasting”) there is many new resources and functionalities available. For example, resources such as webinars and tutorials are available on the new webpage, online availability of summary maps and better tools to download EFAS data.