Feedback on notifications
After the dissemination of a Formal Flood Notification, all the affected EFAS partners are requested to complete an electronic feedback survey. This feedback is used to monitor the performance of the EFAS system and to identify potential improvements to it. During 2019, the feedback collection procedure transitioned from an external service to a system embedded in EFAS-IS, thus simplifying the coupling between notifications and feedback items, and the compilation and processing of the received feedback. The new system allows partners to provide their feedback directly through a link in the Formal Flood Notification message. Additionally, it also enables reporting information about missed events.
Below we present a summary of the feedback provided by EFAS partners during 2019. The statistics provided here are based on the number of responses received to each question in the feedback form, some of which are not compulsory. As a result, the percentages provided for some of the questions may be based on fewer responses.
Summary of received feedback during 2019
In the past, the feedback was evaluated per EFAS Specific Contract (SC) year (May to April). However, starting from 2019, feedback is evaluated based on the calendar year instead. The resulting statistics from the feedback collected during 2019 are then compared to those of previous analyses. The abbreviations SC2, SC3, and SC4 correspond to the reporting periods May 2016 - April 2017, May 2017 - April 2018, and May 2018 - April 2019, respectively.
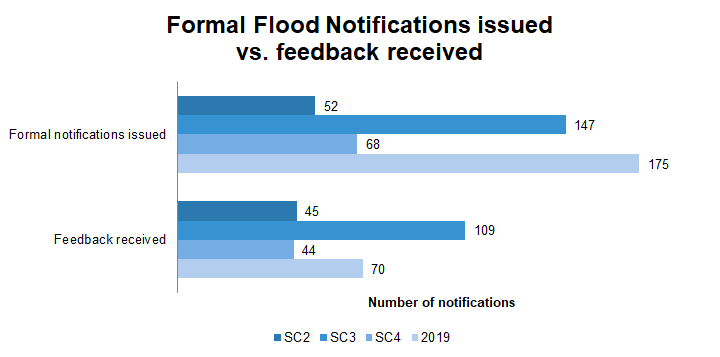
A total of 175 Formal Flood Notifications were sent out during 2019, and 70 feedback reports were received, which accounts for 40% of the issued notifications (Figure 1). This is a decrease compared to the previous analysis (SC4), in which feedback was provided for 65% of the formal flood notifications.
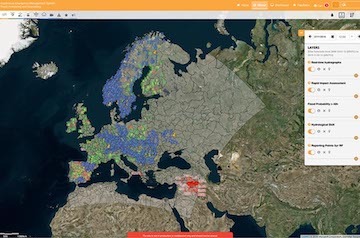
The provided feedback rate varies significantly among EFAS partners (see summary figure at top of page). Even if no detailed survey was performed on the reasons why partners do (not) provide feedback, it is conceivable that the change to the new feedback collection system might have influenced the amount of provided feedback.
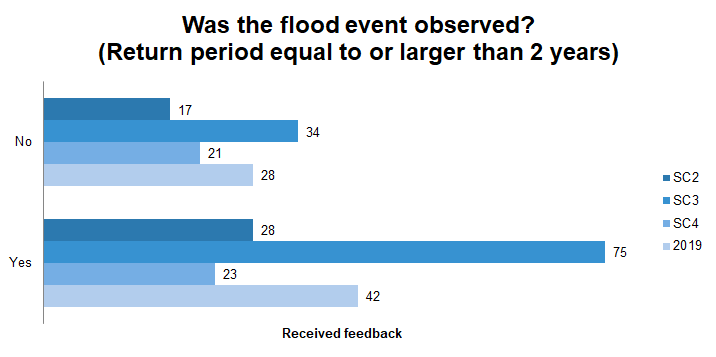
The initial question in the feedback form is whether or not a flood event was observed in connection to an issued Formal Flood Notification. The definition of a flood event is included in the question (i.e. return period equal to or larger than 2 years) to help partners assess the event. The 2-year return period was chosen as a threshold for this question as it allows differentiating between correct rejections and flood events that happened but did not reach the 5-year return period threshold established in EFAS. In total, 42 out of 70 respondents (60%) answered that a flood event was observed after a Formal Flood Notification had been sent out (Figure 2). Note that an affirmative response to this question does not guarantee that the flood event exceeded the 5-year return period threshold. This value is an improvement respect to the previous analysis (SC4).
Feedback from observed flood events
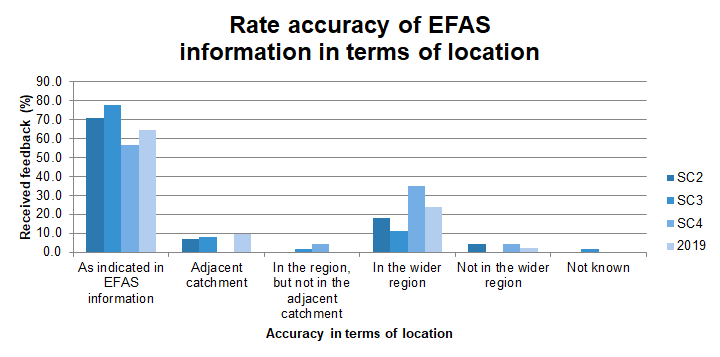
Most of the responders who answered that a flood event had indeed occurred in connection to a Formal Flood Notification (27 out of 42; 64%) rated the accuracy of EFAS information in terms of location as “As indicated in EFAS information” (Figure 3). This is an improvement from the previous analysis (SC4), and is related to a decrease in reported events being "In the wider region".
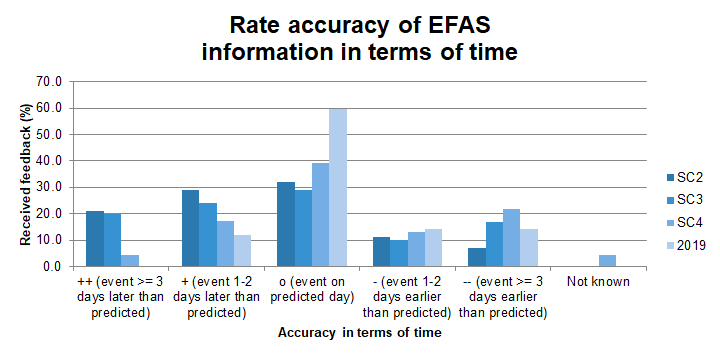
In total, 60% of the responders who answered that the flood event had indeed occurred stated that the flood event happened on the day predicted by EFAS (Figure 4). Additionally, none of the events reported during 2019 occurred more than 2 days later than predicted and only 14% of them occurred more than 2 days earlier than predicted. This is a considerable accuracy improvement in terms of timing respect to previous years.
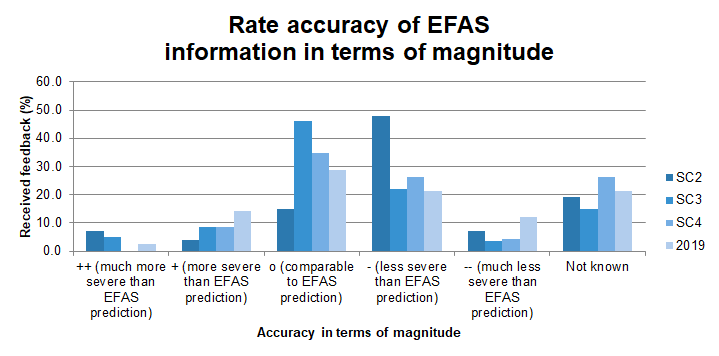
In terms of the magnitude of the predicted event, 29% reported that the actual flood magnitude was comparable to the EFAS prediction (Figure 5). Additionally, 35% answered that the magnitude was less or much less severe than the EFAS prediction, and 17% stated that the flood was more or much more severe than the EFAS prediction. Finally, 21% of the respondents were not aware of the magnitude of the event compared to the EFAS notification. Compared to previous years, there is a decrease in the percentage of reported events with magnitudes comparable to EFAS prediction, and an increase of more severe and much less severe events respect to EFAS prediction.
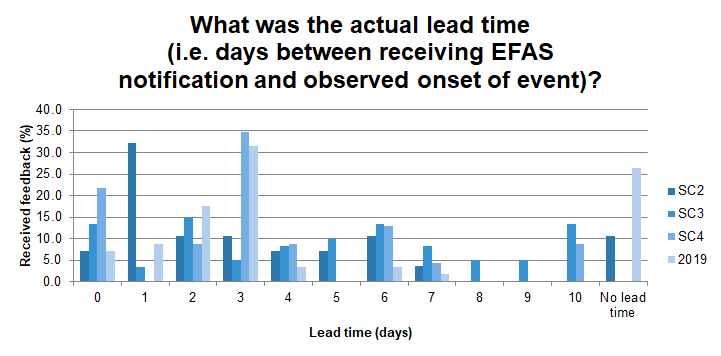
The lead time of EFAS notifications varied greatly between the different flood events, with most notifications (32%) being disseminated three days before the start of an event (Figure 6). In addition, 18% of the notifications were issued with a lead time of 2 days. This is an improvement with respect to previous years, where a significant percentage of notifications were sent with lead times of less than 2 days. Nevertheless, the percentage of notifications with unknown lead time was still significant (26%).
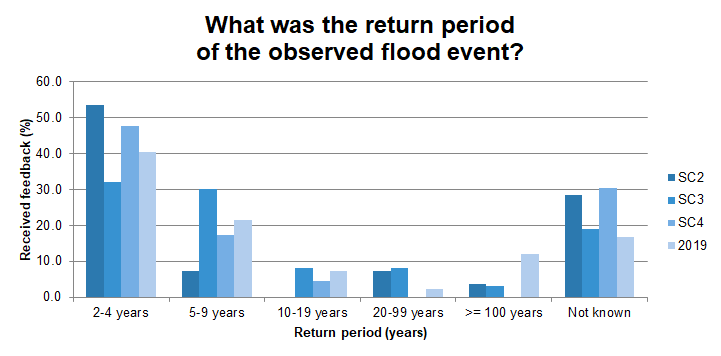
In total, 40% of the respondents who reported that the flood event had indeed occurred stated that the return period of the event was less than a 5-year return period event (Figure 7). Since the criterion for sending out a Formal Flood Notification requires river discharge to exceed the 5-year return period, it is remarkable that so many events were reported to be less severe than that.
The time periods that partners use to calculate the return periods may vary from one partner to another. For instance, the 5-year return period in EFAS is often lower than the 5-year return period threshold that is used in Sweden by the Swedish Meteorological and Hydrological Institute. This could be due to the quality of historical forcing data, hydrological model performance and different time periods used in the return period analysis. In addition, EFAS-based return periods are calculated based on simulated discharges, whereas the EFAS partners base their thresholds on discharge observations. Calculating return periods from simulated discharge values can lead to systematic biases between observed and simulated discharge values at certain locations. A potential solution would be for partner to evaluate the Formal Flood Notifications taking into account the differences between the simulated discharge in EFAS and their recorded observed discharge values.
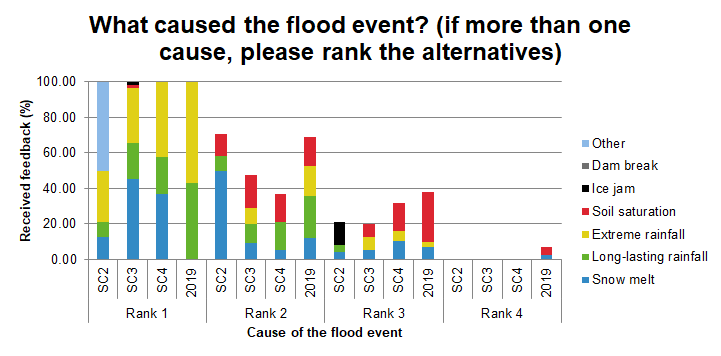
The main drivers behind flood events in 2019 (highest ranked causes) were reported to be extreme rainfall (60% of the respondents) and long-lasting rainfall (40% of the respondents) (Figure 8). These causes were also the most important secondary drivers, followed by soil saturation and snow melting. Extreme rainfall is the only driver that has been reported as being relevant for a significant percentage of reported flood events throughout the different reporting periods. The percentage of reported events mainly caused by long-lasting rainfall has significantly increased in 2019 respect to previous years. Finally, soil saturation is a relevant secondary driver behind many reported events throughout the different reporting periods.
Notification sent but no observed flooding event
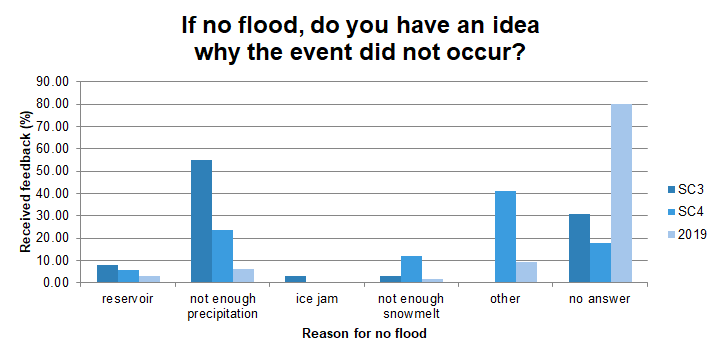
The survey recipients were asked if they had any explanation to why a forecasted flood event did not actually take place. Possible reasons where listed, i.e. among others reservoir operation, precipitation accumulated as snow, forecasted precipitation did not occur or fell in a different area, and not enough snowpack melt. Most recipients did not respond to this question (Figure 9). Of those who did, the most common answer was "other", followed by "not enough precipitation". The reduced number of replies to this question may point to the difficulty of establishing specific causes to false alarms. This question was added during SC3 and therefore no data is available for SC2.
Conclusions
The above analysis allows drawing some key messages as follows:
- Feedback was provided for about a third of the disseminated Formal Flood Notifications. This is a decrease from previous years and might be partially explained by the changes in the feedback collection system.
- 60% of the survey recipients reported observed flooding events tied to the notifications being sent, indicating an improvement from SC4.
- The accuracy of the notifications being sent was perceived to be comparable to previous analyses in terms of location, and better than for previous analyses in terms of timing and lead time. In terms of magnitude, notifications were perceived as being slightly less accurate than for previous analyses. Overall, notifications had a good accuracy.
- The majority of the notifications' recipients stated that the return period of the observed flood events was less than 5 years, which is below the lowest EFAS threshold. In order to avoid the use of different return period thresholds between EFAS and the partners, it is suggested to define the actual discharge value to be evaluated by the partners.
- The main drivers behind flood events in 2019 were extreme rainfall and long-lasting rainfall.
- Based on the recipients' responses to why certain forecasted events did not occur, it may be deduced that establishing causes for false alarms is not always obvious.